 2021, Vol. 38


2. 广州市华南自然资源科学技术研究院, 广州 510642;
3. 广东省科学院生态环境与土壤研究所, 广州 510642;
4. 中国石油集团东方地球物理勘探有限责任公司, 河北 涿州 072751
2. South China Academy of Natural Resources Science and Technology, Guangzhou 510642, China;
3. Institute of Eco-environmental and Soil Sciences, Guangdong Academy of Sciences, Guangzhou 510642, China;
4. BGP Inc., China National Petroleum Corporation, Zhuozhou 072751, China
近几十年,土壤中的重金属污染持续引起全球环境研究人员的高度关注[1-2]。由于土壤中重金属的高毒性、生物不可降解性、持久性和在食物链中的生物蓄积性,重金属会直接或间接地对人体健康造成危害[3]。例如,长期暴露于镉(Cd)环境中会导致人体肾脏功能障碍,Cd会对肺、心血管和肌肉骨骼系统产生不良影响,是对人体最具毒性的重金属之一[4]。铅(Pb)会对血液酶和中枢神经系统产生不良影响[5]。长期接触锌(Zn)会影响胆固醇的平衡[6]。因此,对重金属污染土壤的环境风险评估至关重要。然而,由于受到多种因素的综合影响,土壤中的重金属具有较弱的空间自相关性,使得土壤污染的防治更加困难[7]。因此,准确揭示区域范围内土壤中重金属的空间分布,合理评估重金属对人体健康和生态环境的风险,并适时采取有效的污染缓解措施,对保障当地的农产品质量安全和居民身体健康具有重要意义[8]。
大多数重金属的天然来源是土壤母质,但其在土壤中的浓度低,不易被植物吸收[9]。人类活动(如采矿、工业排放、生活垃圾堆弃、农药化肥使用和污水灌溉)不断将重金属带入环境中,导致土壤环境质量恶化[10-13]。尤其是在金属矿开采的过程中,地质层中的金属可能会释放到环境中,例如,研究发现矿区附近土壤中Cd和Zn的含量远高于控制区[14]。目前,地统计学方法广泛应用于土壤重金属的空间变异和风险评价研究当中[8, 15];富集因子、地累积指数和内梅罗综合指数常用于土壤重金属的环境风险评估;Hakanson生态风险指数和生态风险因子被广泛用于识别土壤重金属的生态风险[16-20]。了解土壤中重金属的污染特征,评估其环境和生态风险,是预防和控制土壤污染的前提,可为土壤污染修复提供重要决策信息[21-22]。
天津市武清区的设施种植业发达,主要为天津市供应蔬菜、粮食。在地理位置上,武清区北连廊坊市,而廊坊拥有丰富的矿产资源以及发达的工业体系。武清区也是北京排污河、北运河及永定河等排污河的主要通道。近些年来,武清区尤其是河西务镇土壤质量下降严重,阻碍了武清区设施种植业的持续健康发展,但单一年份的土壤污染状况难以明确污染来源的动态变化。因此,通过分析不同时期重金属污染的动态变化推断土壤重金属可能污染源是亟待解决的科学问题。本研究以天津市武清区的蔬菜大棚为例,探究不同时期土壤重金属动态变化规律,分析不同时期生态风险以及环境风险,推断土壤重金属的可能污染来源,旨在为武清区土壤污染治理提供理论依据和数据支撑。
1 材料与方法 1.1 研究区概况研究区位置及采样点分布如图 1所示。武清区位于天津市西北部,东与天津市宝坻区、宁河县搭界,南与天津市北辰区、西青区,河北省霸州市相连,西与河北省廊坊市安次区相接,北与北京市通州区、河北省廊坊市香河县比邻。武清区地处华北冲积平原下端,地势平缓,自北、西、南向东南海河入海方向倾斜,海拔最高13 m、最低2.8 m。该地区属于温带大陆性季风气候,年平均气温为11.6 ℃,降雨量为500~610 mm。全年盛行西北风,年平均风速为2~4 m·s-1。区域面积1 574 km2,其中耕地面积9.14万hm2,占土地面积的58%。土壤包括砂性土、壤质土、黏性土三大类[23],该地区蔬菜以菠菜、西红柿、大白菜为主。

|
图 1 研究区位置及采样点分布图 Figure 1 Position and the sampling point distribution of the study area |
本研究以天津市武清区2005年和2019年土壤重金属为研究对象。2005年土壤样点布设按行政区进行分层,每个区进行随机抽样,采集了542个土壤样本,土壤重金属数据来源于农业农村部环境保护科研监测所。2019年根据2005年样点布设进行补充采样,采集了92个土壤样本。采样规则根据《土壤环境监测技术规范》(HJ/T 166—2004)的标准采样程序,在现场采集表层土壤(0~20 cm)样品。每个样品由5个子样混合组成,采样时记录采样点经纬度坐标。土壤样品经过风干、预处理,去除杂草、根系等杂物,再使用2 mm筛过滤砾石。取100 g研磨至全部通过孔径100目尼龙筛,混匀后备用。
1.3 土壤重金属分析方法准确称取0.50 g土壤样品,用王水-高氯酸微波消解(Milestone ETHOS UP)待测。其中,Pb、Cu、Cr、Ni、Zn含量采用火焰原子吸收光谱仪(Analytik Jena novAA 350)测定;Cd含量采用石墨炉原子吸收光谱仪(Analytik Jena ZEEnit 650P)测定;As采用原子荧光光谱仪(北京吉天,AFS-933)测定。重金属全量分析过程中以环境标准物质土壤GBW07430(中国地质科学院地球物理地球化学勘查研究所)为质量控制样品,得到质控样品的各项重金属元素含量回收率均在91%~107%范围内,同时在一定样品数之间加入平行样,平行样标准偏差均在9%以内。
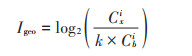
1.4 土壤重金属污染状况评价本研究采用地累积指数(Index of geo-accumulation,Igeo)来评价土壤中重金属污染状况,即比较土壤中的测试含量和自然地球化学背景值,计算公式为[24]:
|
(1) |
式中: Cxi为样品x中测得的重金属i的浓度mg·kg-1;Cbi为当地土壤环境背景值,k为常数,取值为1.5。另外,采用污染负荷指数(Pollution load index,IPL)评价重金属污染程度[25],计算公式为:

|
(2) |
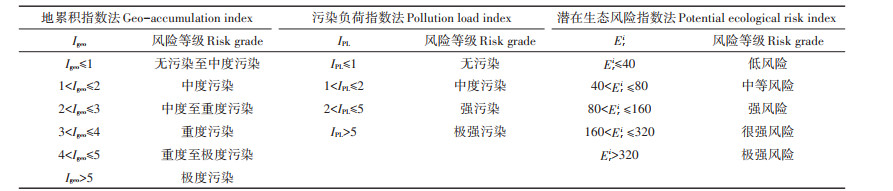
本研究以天津市武清区环境背景值[26]为背景值,以农用地土壤污染风险管控标准(GB 15618—2018) 为评价标准,评价等级如表 1所示。
|
|
表 1 评价方法及其评价标准 Table 1 Evaluation methods and the assessment standards |
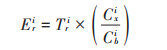
潜在生态风险指数(Potential ecological risk index,IR)是基于土壤重金属含量及其毒性评价土壤重金属生态风险的方法,该指数可反映出多重污染物的综合影响,并可据此定量划分潜在危害程度[27]。计算公式为:
|
(3) |

|
(4) |
式中: Eri为某土壤重金属i的单项潜在生态风险指数;IR为样本点的潜在生态风险指数;Tri为单个重金属i的毒性响应系数,As、Cu、Pb、Cd、Zn、Cr、Ni的毒性响应系数分别为10、5、5、30、1、2、5[27-28]。潜在生态风险等级评价标准如表 1所示。
1.6 数据统计和地统计分析使用SPSS 20.0对土壤特性和重金属含量进行描述性统计分析(最大值、最小值、平均值、标准差等)。利用地统计学方法来确定重金属的空间分布特征,首先使用Kolmogorov-Smirnov(K-S)检验重金属含量是否符合正态分布,对不符合正态分布的数据(Zn、Cd) 进行对数变换标准化,然后在ArcGIS 10.2中使用普通克里格(Ordinary Kriging,OK)法来绘制土壤重金属空间分布图。
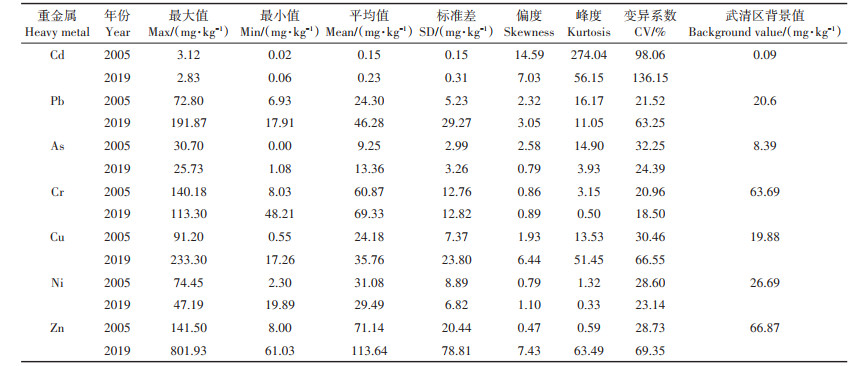
2 结果与分析 2.1 土壤中重金属的积累研究区域内2005年和2019年土壤重金属浓度描述性统计结果如表 2所示。2005年土壤中重金属含量平均值大小依次为Zn(71.14 mg·kg-1)>Cr(60.87 mg·kg-1)>Ni(31.08 mg·kg-1)>Pb(24.30 mg·kg-1)>Cu (24.18 mg · kg-1)>As(9.25 mg · kg-1)>Cd(0.15 mg · kg-1);2019年土壤中重金属含量平均值大小依次为Zn (113.64 mg·kg-1)>Cr(69.33 mg·kg-1)>Pb(46.28 mg· kg-1)>Cu(35.76 mg · kg-1)>Ni(29.49 mg · kg-1)>As (13.36 mg·kg-1)>Cd(0.23 mg·kg-1),未超过《土壤环境质量农用地土壤污染风险管控标准》(GB 15618-2018)的风险筛选值。武清区土壤重金属除Ni外,都呈现不同程度上升趋势,说明人类活动增加了土壤中重金属的累积量[29]。对比武清区土壤背景值发现,2005年土壤中重金属的平均值仅有Cr处于背景值之下,而2019年土壤中重金属的平均值均超过该地区背景值。较高的变异系数(Coefficient of variance,CV)表示重金属的空间分布不均匀[24]。经过数据分析(表 2) 发现,2005年土壤中仅有重金属Cd变异系数较高,而2019年土壤中重金属Cd、Zn、Cu和Pb的变异系数分别为136.15%、69.35%、66.55%和63.25%,表明采样点之间的变异程度很高,说明该地区土壤受到严重的人为活动影响[24, 30]。
|
|
表 2 土壤及重金属含量描述统计 Table 2 Statistical results of soil heavy metal contents |
2005年研究区土壤重金属地累积指数和潜在生态风险指数结果如图 2所示。地累积指数平均值大小依次为Cd(0.00)>Cu(-0.37)>Pb(-0.38)>Ni (-0.43)>As (-0.50)>Zn(-0.56)>Cr(-0.68)。根据地累积指数等级划分,542个土壤采样点中重金属Cd有26个采样点处于中度污染,2个采样点处于中度至重度污染,重度污染和重度至极度污染各有1个采样点。土壤重金属As、Cu和Pb分别有4、2和1个采样点处于中度污染。此外,有392个(72.32%)和17个(3.14%)土壤样点处于中等污染(1 < IPL≤2)和高污染(2 < IPL≤5)水平。

|
图 2 2005年研究区重金属地累积指数(Igeo,a)和潜在生态风险指数(Eri,b) Figure 2 Geo-accumulation index(Igeo, a)and ecological risk index(Eri, b)of heavy metals in 2005 |
2005年研究区土壤中7种重金属的综合潜在生态风险指数范围为21.36~131.21,其中,有6个(1.11%)土壤样点具有极强的生态风险,而中等生态风险、强生态风险分别有291个(53.69%)和237个(43.73%)样点。不同重金属单项污染风险指数依次表现为Cd>As>Ni>Cu>Pb>Cr>Zn。总的来说,Cd、As和Cu是土壤中的主要有毒元素,会对当地环境构成潜在风险,且Cd、As是研究区生态风险的主要贡献者。
2019年土壤重金属地累积指数如图 3所示,平均值大小依次为Cd(0.41)>Pb(0.40)>Cu(0.13)>Zn(0.06)>As(0.03)>Ni (-0.48)>Cr (-0.49),表明Cd、Pb、Cu和Zn在土壤中的积累量比其他重金属高,有13.68%、12.63%、3.15% 和1.05% 的土壤样品Cd、Pb、Cu和Zn处于中度污染(Igeo>1)到极度污染(Igeo≤5)之间。此外,有85.26% 和14.74% 的土壤样品处于中等污染(1 < IPL≤2)和强污染(2 < IPL≤5)水平。

|
图 3 2019年研究区重金属地累积指数(Igeo,a)和潜在生态风险指数(Eri,b) Figure 3 Geo-accumulation index(Igeo, a)and ecological risk index(Eri, b)of heavy metals in 2019 |
2019年研究区土壤中7种重金属的综合潜在生态风险指数范围为0.91~942.67,表明土壤中累积的重金属对当地生态系统具有潜在生态危害。其中,有1.05%的土壤样品具有很强的生态风险,而中等生态风险、强生态风险样点分别占9.47% 和2.10%。不同重金属单项生态风险指数依次表现为Cd>As>Pb> Cu>Ni>Cr>Zn,这与Igeo的评价结果一致。总而言之,Cd、As、Pb和Cu是土壤中的主要有毒元素,对当地环境构成潜在风险,并且Cd、As是研究区生态风险的主要贡献者。
2.3 土壤重金属的空间特征重金属的空间变化可用于确定热点区域并识别土壤重金属的潜在来源。普通克里格插值均方根标准误差(Root mean square standardized error,RMSSE) 值在0.980~1.003之间,表明标准误差是准确的,重金属的空间分布结果如图 4和图 5所示。从2005年重金属含量空间分布(图 4)可以看出,Cu、Cr、Ni、Zn和As具有相似的空间分布特征,高值区集中在研究区的西南部,Pb的高值区呈现面源污染特征,而Cd呈现明显的点源污染特征。

|
图 4 2005年研究区重金属的空间分布 Figure 4 Spatial distribution of heavy metals in the study area in 2005 |
从2019年重金属含量空间分布(图 5)可以看出,Cu和Cd的高值区分别在东北部和中部,呈现明显的点源污染特征;Cr、Ni和As的空间分布特征相似,高值区位于西南部;Pb和Zn呈现面源污染特征,Pb覆盖了武清区大部分区域,而Zn高值区主要在西北和西南部分地区。

|
图 5 2019年研究区重金属的空间分布 Figure 5 Spatial distribution of heavy metals in the study area in 2019 |
随着时间的积累,研究区2019年土壤重金属Cd、As、Cr、Cu和Zn的平均含量为2005年的1.5倍以上,而2019年重金属Pb的平均含量约为2005年的2倍,仅有重金属Ni的浓度保持健康状态,说明人为活动对土壤重金属的影响严重。2005年和2019年天津市武清区土壤重金属地累积指数和潜在生态风险指数评价结果显示,Cd和As是研究区生态风险的主要贡献者。这与冯英等[31]得出的我国蔬菜地土壤主要污染元素为Cd、Hg、Pb、As、Cr的综述性研究结果一致。总体上,研究区地累积指数和潜在生态风险指数结果表明Cd污染最严重,其次为As污染,进一步表明研究区设施农田土壤重金属来源以工业排放为主,尤其是污水灌溉。
3.2 土壤重金属的空间格局及驱动因素通过对比2005年和2019年重金属元素的空间分布特征可得出,Cu和Zn的空间分布在两个年份上具有高度相似性,Zn和Cu作为牲畜日常饲料的添加剂的固有成分进入到了动物粪便中,Zn和Cu通常是牲畜粪便应用的标志物[32-33],因此推断Cu和Zn的富集可能源于农业施肥。重金属Zn高值区均集中在北京排污河及永定河一线,距离河流越近,Zn含量越高,可见重金属Zn累积必然受到污灌的影响,这与宋志廷等[33]对天津市武清区重金属来源解析结果一致,说明重金属Zn累积受农业施肥和污灌的双重影响。
土壤重金属Cr、Ni和As在两个年份的空间分布上具有相似的特征,并且集中分布于研究区的河流中下游,表明Cr、Ni和As具有相同的污染源。Ni、Cr和As通常被认为是自然来源的指标,已有研究证明,伊朗伊斯法罕工业区农业土壤中Ni、Co、Cr、Fe和Al的主要来源是地质成因[34]。本研究中Ni、Cr和As重金属的平均含量均接近各地区背景值,根据地累积指数和污染负荷指数划分污染等级,仅有少量样点的As对环境造成危害,因此推断Ni、Cr和As的可能来源为成土母质,这与宋志廷等[33]对天津市武清区的研究结果一致。
由重金属的空间分布(图 4和图 5)可以看出,Cd的空间分布相对集中,呈现点源污染特征,由Google Earth查询结果可知,Cd高值区内共有10家重金属排污企业,主要企业类型为电镀、电子和化工类。密集的工业活动是Cd的重要来源之一[16],这些区域有较多工业活动,例如合金加工、印刷和染色工业。说明重金属Cd污染可能受到工业活动的影响。
Pb含量高的地区靠近交通发达的主干道,而汽车尾气通常含有大量的Pb[35-36]。尽管我国从2000年开始禁止使用含Pb汽油,但数十年的使用历史已导致道路周围土壤受到严重的Pb污染[37]。随着距道路距离的增大,Pb的浓度呈现下降趋势[37],结合空间分布特征,重金属Pb高值区域位于该地区的主干道附近,如高速公路、国道和省道。综上可推断,重金属Pb累积来源为交通排放。
4 结论(1) 描述性统计表明随着时间的推移,武清区土壤重金属Pb、Cu、Cr、Zn、Cd和As含量不断累积,至2019年土壤重金属Pb、Cu、Cr、Zn、Cd和As含量均超过该地区背景值。
(2) 地累积指数和潜在生态风险指数结果表明,Cd和As是研究区生态风险的主要贡献者。
(3) 土壤重金属空间分布特征表明,研究区土壤中Cu主要受农业施肥的影响,Zn则主要受农业施肥和污灌的双重影响,As、Ni和Cr主要来自成土母质,Cd可能来源于工业活动,Pb则归因于交通尾气的排放。
| [1] |
HE M J, SHEN H R, LI Z T, et al. Ten-year regional monitoring of soil-rice grain contamination by heavy metals with implications for target remediation and food safety[J]. Environmental Pollution, 2019, 244: 431-439. DOI:10.1016/j.envpol.2018.10.070 |
| [2] |
YU S Y, CHEN Z L, ZHAO K L, et al. Spatial patterns of potentially hazardous metals in soils of Lin' an City, southeastern China[J]. International Journal of Environmental Research and Public Health, 2019, 16(2): 246. DOI:10.3390/ijerph16020246 |
| [3] |
ZHANG F S, LI Y X, YANG M, et al. Content of heavy metals in animal feeds and manures from farms of different scales in northeast China[J]. International Journal of Environmental Research and Public Health, 2012, 9(8): 2658-2668. DOI:10.3390/ijerph9082658 |
| [4] |
ŻUKOWSKA J, BIZIUK M. Methodological evaluation of method for dietary heavy metal intake[J]. Journal of Food Science, 2008, 73(2): R21-R29. DOI:10.1111/j.1750-3841.2007.00648.x |
| [5] |
KAUFMANN R B, STAES C J, MATTE T D. Deaths related to lead poisoning in the United States, 1979-1998[J]. Environmental Research, 2003, 91(2): 78-84. DOI:10.1016/S0013-9351(02)00017-8 |
| [6] |
ZHANG X W, YANG L S, LI Y H, et al. Impacts of lead/zinc mining and smelting on the environment and human health in China[J]. Environmental Monitoring and Assessment, 2012, 184(4): 2261-2273. DOI:10.1007/s10661-011-2115-6 |
| [7] |
ZHAO K L, LIU X M, ZHANG W W, et al. Spatial dependence and bioavailability of metal fractions in paddy fields on metal concentrations in rice grain at a regional scale[J]. Journal of Soils and Sediments, 2011, 11(7): 1165-1177. DOI:10.1007/s11368-011-0408-6 |
| [8] |
HOU D Y, O' CONNOR D, NATHANAIL P, et al. Integrated GIS and multivariate statistical analysis for regional scale assessment of heavy metal soil contamination: A critical review[J]. Environmental Pollution, 2017, 231: 1188-1200. DOI:10.1016/j.envpol.2017.07.021 |
| [9] |
SONG H Y, HU K L, YI A, et al. Spatial distribution and source apportionment of the heavy metals in the agricultural soil in a regional scale[J]. Journal of Soils and Sediments, 2018, 18(3): 852-862. DOI:10.1007/s11368-017-1795-0 |
| [10] |
YANG S L, ZHOU D Q, YU H Y, et al. Distribution and speciation of metals(Cu, Zn, Cd, and Pb) in agricultural and non-agricultural soils near a stream upriver from the Pearl River, China[J]. Environmental Pollution, 2013, 177: 64-70. DOI:10.1016/j.envpol.2013.01.044 |
| [11] |
SUN L, LIAO X Y, YAN X L, et al. Evaluation of heavy metal and polycyclic aromatic hydrocarbons accumulation in plants from typical industrial sites: Potential candidate in phytoremediation for co-contamination[J]. Environmental Science and Pollution Research, 2014, 21(21): 12494-12504. DOI:10.1007/s11356-014-3171-6 |
| [12] |
PAN L B, MA J, WANG X L, et al. Heavy metals in soils from a typical county in Shanxi Province, China: Levels, sources and spatial distribution[J]. Chemosphere, 2016, 148: 248-254. DOI:10.1016/j.chemosphere.2015.12.049 |
| [13] |
LI Y F, HU S D, CHEN J H, et al. Effects of biochar application in forest ecosystems on soil properties and greenhouse gas emissions: A review[J]. Journal of Soils and Sediments, 2018, 18(2): 546-563. DOI:10.1007/s11368-017-1906-y |
| [14] |
RODRÍGUEZ L, RUIZ E, ALONSO-AZCÁRATE J, et al. Heavy metal distribution and chemical speciation in tailings and soils around a Pb-Zn mine in Spain[J]. Journal of Environmental Management, 2009, 90(2): 1106-1116. DOI:10.1016/j.jenvman.2008.04.007 |
| [15] |
ZHAO K L, FU W J, QIU Q Z, et al. Spatial patterns of potentially hazardous metals in paddy soils in a typical electrical waste dismantling area and their pollution characteristics[J]. Geoderma, 2019, 337: 453-462. DOI:10.1016/j.geoderma.2018.10.004 |
| [16] |
YAYLALI-ABANUZ G. Heavy metal contamination of surface soil around Gebze industrial area, Turkey[J]. Microchemical Journal, 2011, 99(1): 82-92. DOI:10.1016/j.microc.2011.04.004 |
| [17] |
DONG R Z, JIA Z M, LI S Y. Risk assessment and sources identification of soil heavy metals in a typical county of Chongqing Municipality, southwest China[J]. Process Safety and Environmental Protection, 2018, 113: 275-281. DOI:10.1016/j.psep.2017.10.021 |
| [18] |
JIA Z M, LI S Y, WANG L. Assessment of soil heavy metals for ecoenvironment and human health in a rapidly urbanization area of the upper Yangtze Basin[J]. Scientific Reports, 2018, 8(1): 3256. DOI:10.1038/s41598-018-21569-6 |
| [19] |
NI M F, MAO R, JIA Z M, et al. Heavy metals in soils of Hechuan County in the upper Yangtze(SW China): Comparative pollution assessment using multiple indices with high-spatial-resolution sampling[J]. Ecotoxicology and Environmental Safety, 2018, 148: 644-651. DOI:10.1016/j.ecoenv.2017.11.009 |
| [20] |
WU J, LU J, LI L M, et al. Pollution, ecological-health risks, and sources of heavy metals in soil of the northeastern Qinghai-Tibet Plateau[J]. Chemosphere, 2018, 201: 234-242. DOI:10.1016/j.chemosphere.2018.02.122 |
| [21] |
CHEN H Y, TENG Y G, LU S J, et al. Contamination features and health risk of soil heavy metals in China[J]. Science of the Total Environment, 2015, 512/513: 143-153. DOI:10.1016/j.scitotenv.2015.01.025 |
| [22] |
YE S J, ZENG G M, WU H P, et al. Biological technologies for the remediation of co-contaminated soil[J]. Critical Reviews in Biotechnology, 2017, 37(8): 1062-1076. DOI:10.1080/07388551.2017.1304357 |
| [23] |
蒋德勤. 天津土种志[M]. 天津: 天津科学技术出版社, 1990. JIANG D Q. A database of soil species in Tianjin[M]. Tianjin: Tianjin Science and Technology Press, 1990. |
| [24] |
ZHANG P Y, QIN C Z, HONG X, et al. Risk assessment and source analysis of soil heavy metal pollution from lower reaches of Yellow River irrigation in China[J]. Science of the Total Environment, 2018, 633: 1136-1147. DOI:10.1016/j.scitotenv.2018.03.228 |
| [25] |
ZHAO H T, ZHAO J, YIN C Q, et al. Index models to evaluate the potential metal pollution contribution from washoff of road-deposited sediment[J]. Water Research, 2014, 59: 71-79. DOI:10.1016/j.watres.2014.04.012 |
| [26] |
范华义, 张文具. 天津市土壤元素背景值的地域差异及成因分析[J]. 城市环境与城市生态, 2002, 15(1): 13-14. FAN H Y, ZHANG W J. The area differentiation of the soil elemendts in Tianjin and its cause of formation[J]. Urban Environment & Urban Ecology, 2002, 15(1): 13-14. |
| [27] |
HAKANSON L. An ecological risk index for aquatic pollution control: A sedimentological approach[J]. Water Research, 1980, 14(8): 975-1001. DOI:10.1016/0043-1354(80)90143-8 |
| [28] |
RAVANKHAH N, MIRZAEI R, MASOUM S. Spatial eco-risk assessment of heavy metals in the surface soils of industrial city of Aran-obidgol, Iran[J]. Bulletin of Environmental Contamination and Toxicology, 2016, 96(4): 516-523. DOI:10.1007/s00128-016-1761-3 |
| [29] |
戴塔根, 李新, 吴堑虹. 长株潭城市区土壤中重金属元素分布特征的时空变化[J]. 地球与环境, 2008, 36(4): 321-326. DAI T G, LI X, WU Q H. Variations in the contents of heavy metal elements at different times in Changsha, Zhuzhou and Xiangtan urban aeras of Hunan Province[J]. Earth and Environment, 2008, 36(4): 321-326. |
| [30] |
WU J, LU J, LI L M, et al. Pollution, ecological-health risks, and sources of heavy metals in soil of the northeastern Qinghai-Tibet Plateau[J]. Chemosphere, 2018, 201: 234-242. DOI:10.1016/j.chemosphere.2018.02.122 |
| [31] |
冯英, 马璐瑶, 王琼, 等. 我国土壤-蔬菜作物系统重金属污染及其安全生产综合农艺调控技术[J]. 农业环境科学学报, 2018, 37(11): 2359-2370. FENG Y, MA L Y, WANG Q, et al. Heavy-metal pollution and safety production technologies of soil-vegetable crop systems in China[J]. Journal of Agro-Environment Science, 2018, 37(11): 2359-2370. DOI:10.11654/jaes.2018-0787 |
| [32] |
BELON E, BOISSON M, DEPORTES I Z, et al. An inventory of trace elements inputs to French agricultural soils[J]. Science of the Total Environment, 2012, 439: 87-95. DOI:10.1016/j.scitotenv.2012.09.011 |
| [33] |
宋志廷, 赵玉杰, 周其文, 等. 基于地质统计及随机模拟技术的天津武清区土壤重金属源解析[J]. 环境科学, 2016, 37(7): 2756-2762. SONG Z T, ZHAO Y J, ZHOU Q W, et al. Applications of geostatistical analyses and stochastic models to identify sources of soil heavy metals in Wuqing District, Tianjin, China[J]. Environmental Science, 2016, 37(7): 2756-2762. |
| [34] |
ESMAEILI A, MOORE F, KESHAVARZI B, et al. A geochemical survey of heavy metals in agricultural and background soils of the Isfahan industrial zone, Iran[J]. Catena, 2014, 121: 88-98. DOI:10.1016/j.catena.2014.05.003 |
| [35] |
CHEN X, Xia X H, ZHAO Y, et al. Heavy metal concentrations in roadside soils and correlation with urban traffic in Beijing, China[J]. Journal of Hazardous Materials, 2010, 181(1): 640-646. |
| [36] |
VIARD B, PIHAN F, PROMEYRAT S, et al. Integrated assessment of heavy metal(Pb, Zn, Cd) highway pollution: Bioaccumulation in soil, Graminaceae and land snails[J]. Chemosphere, 2004, 55(10): 1349-1359. DOI:10.1016/j.chemosphere.2004.01.003 |
| [37] |
CHEN T, CHANG Q R, LIU J, et al. Identification of soil heavy metal sources and improvement in spatial mapping based on soil spectral information: A case study in northwest China[J]. Science of the total Environment, 2016, 565: 155-164. DOI:10.1016/j.scitotenv.2016.04.163 |